
The question “is samsung richer than apple?” often sparks debate. Recent financial data shows that Apple stands as the world's most profitable corporation, with a market cap of about $2.3 trillion and yearly earnings reaching $63.9 billion. Samsung, while impressive, holds a market cap of $388.02 billion and strong revenue figures. The table below highlights the key numbers:
|
Metric |
Value |
|---|---|
|
Samsung Market Capitalization |
$388.02 billion (2023) |
|
Apple Market Capitalization |
~$2.3 trillion (2023) |
|
Samsung Operating Profit |
KRW 10.4 trillion (Q2 2024) |
|
Apple Yearly Earnings |
$63.9 billion (2023) |
This comparison matters because many people want to know who leads in market cap and profit. Vertu, though known for luxury, operates on a much smaller scale than either Samsung or Apple.
Key Takeaways
-
Apple is much larger than Samsung in market value, with a market cap near $3 trillion compared to Samsung's $392 billion.
-
Apple earns higher profits and keeps more money from each sale due to its focus on premium products and services.
-
Samsung sells more products across many industries, which helps it stay stable but results in lower profit margins.
-
Apple holds much more cash, giving it greater flexibility to invest and handle challenges.
-
Both companies impact the global economy differently, with Apple leading in profit and brand loyalty, and Samsung excelling in business diversity and technology production.
Samsung vs. Apple: Market Value
Apple’s Market Cap
Apple stands as one of the largest companies in the world. According to recent financial data from YCharts, Apple’s market capitalization reached about $2.972 trillion USD on June 12, 2025. This number comes from multiplying the company’s stock price by the total number of shares. Other sources, such as CompaniesMarketCap and Nasdaq, confirm this value, reporting Apple’s market cap at $2.975 trillion USD on the same date. Public.com also shows that Apple’s market cap has stayed close to $2.97 trillion in June 2025, after reaching as high as $3.69 trillion earlier in the year. These numbers show Apple’s strong position among global companies.
Samsung’s Market Cap
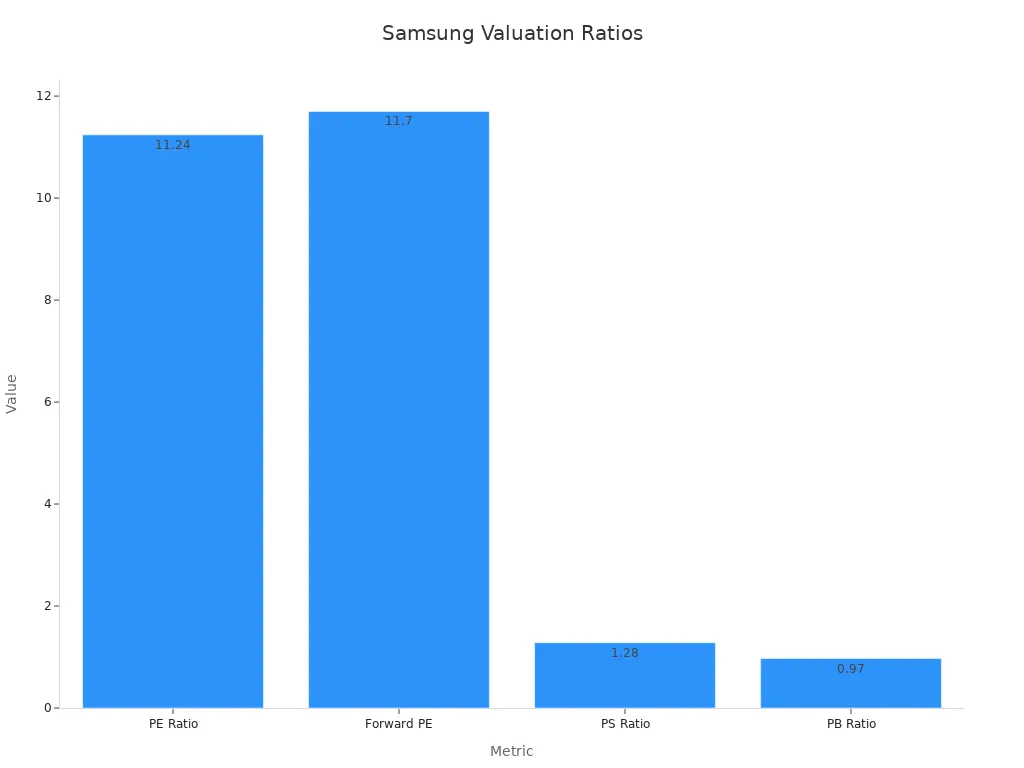
Samsung is a major competitor in the technology industry. As of June 13, 2025, Samsung’s market cap stands at about $392 billion USD, according to Reuters. Some financial tables show Samsung’s market cap at $273.47 billion or $247.40 billion, depending on the source and calculation method. The most recent and widely accepted figure is $392 billion. Samsung’s financial data also includes important ratios and margins, which help investors understand its value.
Why Market Value Matters
Market cap is the most common way to compare the size of companies like Apple and Samsung. It helps investors see which company leads in the “samsung vs. apple” debate. Market capitalization shows how much the market values a company at a certain time. Large companies, such as Apple, often have more stability and financial strength than smaller ones. Investors use market cap to decide where to put their money and to compare different companies. However, market cap does not show everything about a company’s health. It does not include debt, assets, or future growth. People should use it with other financial numbers for a full picture.
Revenue & Profit: Who Makes More Money
Apple’s Revenue and Profit
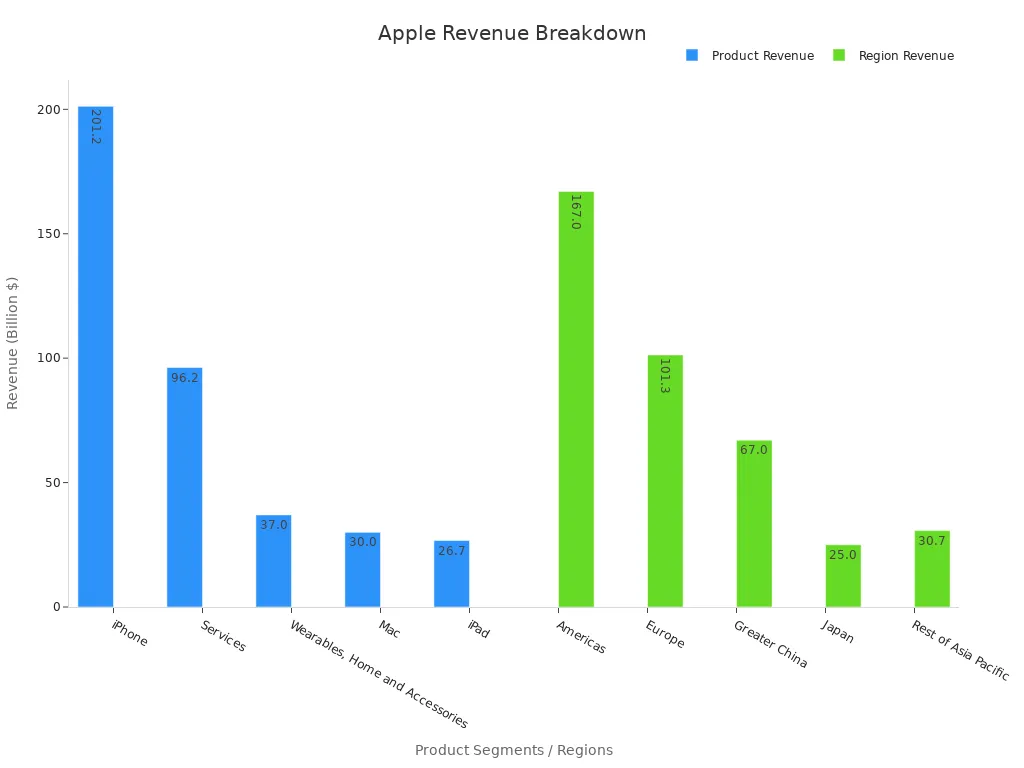
Apple continues to show strong financial results. For the fiscal year ending September 28, 2024, Apple reported total annual revenue of about $391 billion. This number grew by around 2% from the previous year. The iPhone remains the biggest part of Apple’s business, making up 51% of total revenues. Services, such as iCloud and Apple Music, add another 25%. Other products like wearables, Macs, and iPads also contribute to the company’s sales.
|
Product Segment |
Revenue (Billion $) |
Share of Total Revenue |
|---|---|---|
|
iPhone |
201.2 |
51% |
|
Services |
96.2 |
25% |
|
Wearables, Home and Accessories |
37.0 |
9% |
|
Mac |
30.0 |
8% |
|
iPad |
26.7 |
7% |
Apple’s profit margins remain high. Over the past five years, Apple’s free cash flow margin averaged 26.3%. The company’s return on invested capital reached 90.6%, showing efficient use of resources. Apple’s focus on premium devices and services helps it earn more profit per sale than most competitors.
Samsung’s Revenue and Profit
Samsung also posts impressive numbers. In 2022, Samsung’s revenue reached about 302.23 trillion KRW, or roughly $226.5 billion. The company’s net profit for 2023 was 43.38 trillion KRW, or about $32.5 billion. Samsung’s business covers many areas, including smartphones, TVs, semiconductors, and home appliances. The Device Solutions segment, which includes chips and displays, brings in a large share of revenues. Samsung’s smartphone sales remain strong, with the company holding about 27% of the global market in early 2023.
|
Metric |
2024 (KRW billion) |
2023 (KRW billion) |
YoY Change |
|---|---|---|---|
|
Revenue |
138,282 |
132,768 |
+4.2% |
|
Operating Profit |
9,111 |
8,082 |
+12.7% |
Samsung’s profit margins are lower than Apple’s, often around 10%. The company’s wide range of products means some areas, like semiconductors, have higher costs and lower profits.
Profitability Comparison
Apple leads in profitability, even though Samsung sometimes has higher total revenues in certain years. Apple’s profit margin stands at about 25%, while Samsung’s is closer to 10%. This difference comes from Apple’s premium pricing and focus on high-end devices. In the global smartphone market, Apple earns more profit from iPhones than Samsung does from its smartphones, even though Samsung sells more units. Apple’s share of annual smartphone profits is the highest in the industry.
Note: Apple’s business model, with its focus on premium products and services, helps it capture a larger share of global smartphone revenues and profits. Samsung’s broader product range brings in more sales but results in lower profit margins.
|
Metric |
Apple |
Samsung |
|---|---|---|
|
Profit Margin |
16.9% |
|
|
Revenue |
Lower than Samsung |
Higher than Apple |
|
Units Shipped |
Fewer |
More |
|
Market Profit Share |
Larger share of smartphone profits |
Smaller share despite volume |
Is Samsung Richer Than Apple?
Financial Strength
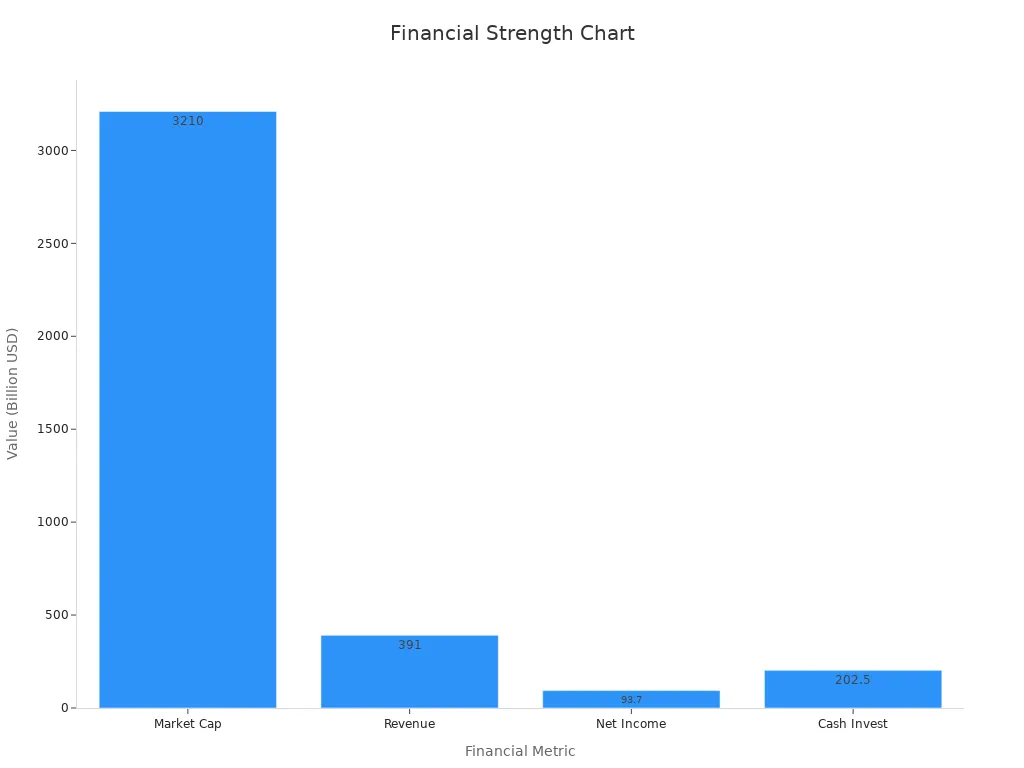
Many people ask, “is samsung richer than apple?” To answer this, it helps to look at several financial measures. Apple holds the title of the world's most valuable company, with a market capitalization near $3 trillion. Samsung's market cap is much lower, around $392 billion. Both companies earn large revenues and have strong positions in the technology industry. Apple focuses on high-end products and services, while Samsung has a broad business that includes consumer electronics, semiconductors, and mobile devices.
Here is a table comparing their business models and financial flexibility:
|
Metric |
Samsung |
Apple |
|---|---|---|
|
Business Diversification |
Broad: Consumer Electronics, Device Solutions, Mobile Electronics |
Focused: High-end products and services (iPhones, MacBooks, Services) |
|
Global Smartphone Market Share |
~20% |
~14% |
|
Market Capitalization |
$392 billion |
Nearly $3 trillion |
|
Annual Smartphone Profits |
Lower than Apple |
Higher than Samsung |
|
Product Strategy |
Diversified portfolio, flexibility to compete in multiple segments |
High-end, premium pricing, strong brand loyalty |
|
Innovation Focus |
Broad product range, including components used by Apple |
Innovation in software and hardware, high consumer anticipation |
|
Financial Flexibility |
Supported by diversification and cash holdings |
Supported by high profits and market value |
Apple’s financial strength comes from its high profit margins and strong brand loyalty. Samsung’s strength comes from its ability to compete in many markets and its steady cash flow from different business areas. Both companies use their financial power to invest in new technology and stay ahead of competitors.
Cash on Hand
Cash reserves show how much money a company can use quickly. This is important when asking, “is samsung richer than apple?” Apple has built up large cash reserves over the years. In March 2022, Apple held about $202.5 billion in cash and investments. This amount is larger than the cash reserves of many countries. Samsung’s cash reserves are also strong, but smaller than Apple’s. In 2018, Samsung held about $31.4 billion in cash. Both companies keep high cash-to-assets ratios to fund innovation and protect against market changes.
Here is a table showing their cash positions:
|
Company |
Cash and Investments (Most Recent) |
|---|---|
|
Apple |
$202.5 billion (Mar 2022) |
|
Samsung |
$31.4 billion (2018) |
Note: Apple’s large cash reserves give it more flexibility to invest in new products, buy other companies, and return money to shareholders. Samsung’s cash helps it manage its many business areas and invest in new technology.
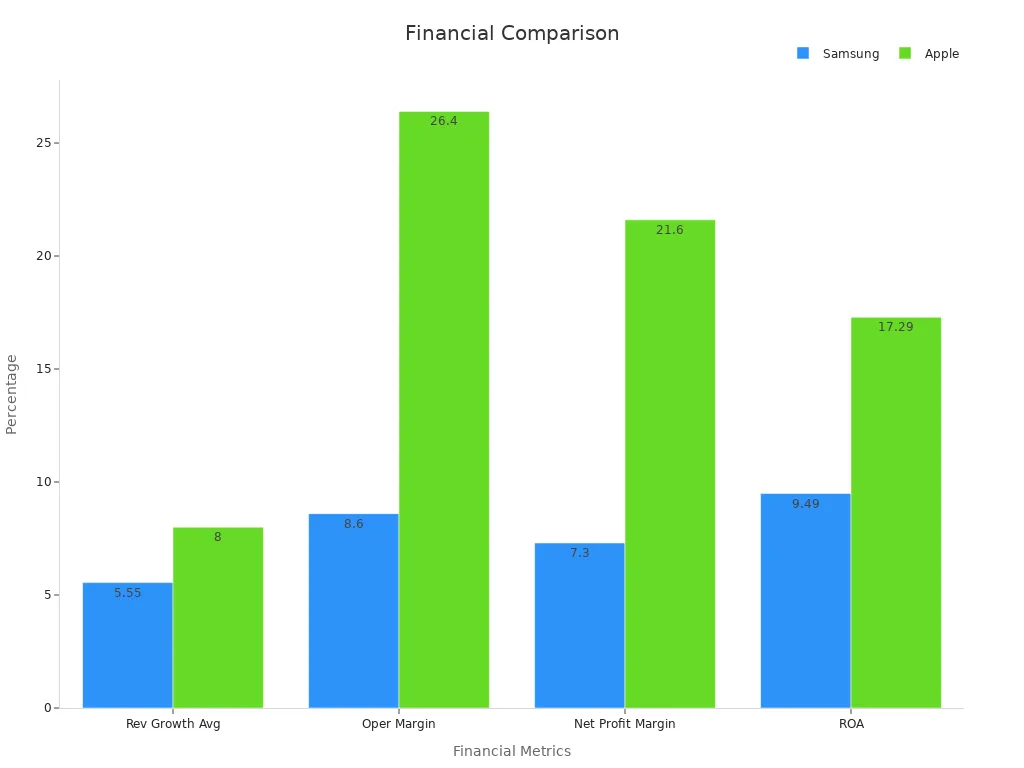
Global Impact
Apple and Samsung both shape the global economy, but in different ways. Samsung plays a key role in South Korea’s economy. It provides jobs, supports local industries, and helps drive the country’s exports. Samsung’s investments in semiconductors and electronics have made South Korea a leader in technology.
Apple’s influence stretches across the world. The company has over 500 stores in 23 countries and more than 190 million active iPhones in China alone. Apple’s focus on premium products and services has changed how people use technology. The company’s global reach and high profit margins make it a leader in the tech industry.
Here is a table that highlights their worldwide impact:
|
Metric |
Samsung Electronics Company |
Apple Inc. |
|---|---|---|
|
Revenue (2013 Q3) |
59.08 trillion KRW (~$55 billion) |
$37.4 billion |
|
Operating Margin |
8.6% |
26.4% |
|
Net Profit Margin |
7.3% |
21.6% |
|
Global Retail Presence |
Strong in Asia and Europe |
Over 500 stores in 23 countries |
|
Key Investments |
Semiconductors, electronics |
Services, retail, acquisitions |
Apple’s global financial influence comes from its ability to create high-margin products and services that people want. Samsung’s impact comes from its wide range of products and its importance to South Korea’s economy.
In summary, when people ask, “is samsung richer than apple?” the answer depends on what they measure. Apple leads in market value, profit, and cash reserves. Samsung leads in business diversity and plays a vital role in its home country’s economy. Both companies have a huge impact on the world, but Apple stands out as the richer company by most financial measures.
Business Models: Apple vs. Samsung
Apple’s Focus
Apple builds its business around premium devices and services. The company chooses quality over quantity, aiming for a seamless user experience. This approach leads to higher profits and strong customer loyalty. Key points about Apple’s strategy include:
-
Average Revenue Per User (ARPU) reaches $140, much higher than Samsung’s $40.
-
The Apple ecosystem connects hardware, software, and services like iCloud and Apple Pay, making it easy for users to stay within the brand.
-
Services now make up 25% of Apple’s total revenue, showing a shift toward recurring income.
-
Apple controls both hardware and software, which helps maintain high standards.
-
The company holds over 4,000 design patents and invests in new areas like AR/VR and healthcare.
-
Devices such as iPhones, Macs, and AirPods work together smoothly, creating a premium experience.
This focus on excellence and integration allows Apple to charge more for its products and keep customers coming back.
Samsung’s Diversification
Samsung operates in many industries, not just electronics. The company’s business covers semiconductors, construction, insurance, biopharmaceuticals, and more. This broad scope helps Samsung balance risks and grow steadily. The table below shows how Samsung’s divisions contribute to its revenue:
|
Samsung Division |
Revenue (2024) |
Net Income (2024) |
Notes |
|---|---|---|---|
|
Samsung Electronics |
KRW 300.9 trillion |
KRW 32.7 trillion |
Includes IT, mobile, and consumer electronics |
|
Semiconductor Division |
~KRW 8.5 trillion (Q1) |
N/A |
Strong in memory chips and displays |
|
Samsung C&T (Construction) |
KRW 34.5 trillion |
KRW 1.12 trillion |
Major global projects |
|
Samsung Biologics |
KRW 3.5 trillion |
KRW 650 billion |
Biopharmaceutical manufacturing |
|
HARMAN International |
USD 9.5 billion (~KRW 12.4T) |
USD 850 million (~KRW 1.1T) |
Connected car systems |
|
Samsung Life Insurance |
KRW 35.5 trillion |
KRW 1.5 trillion |
Insurance and financial services |
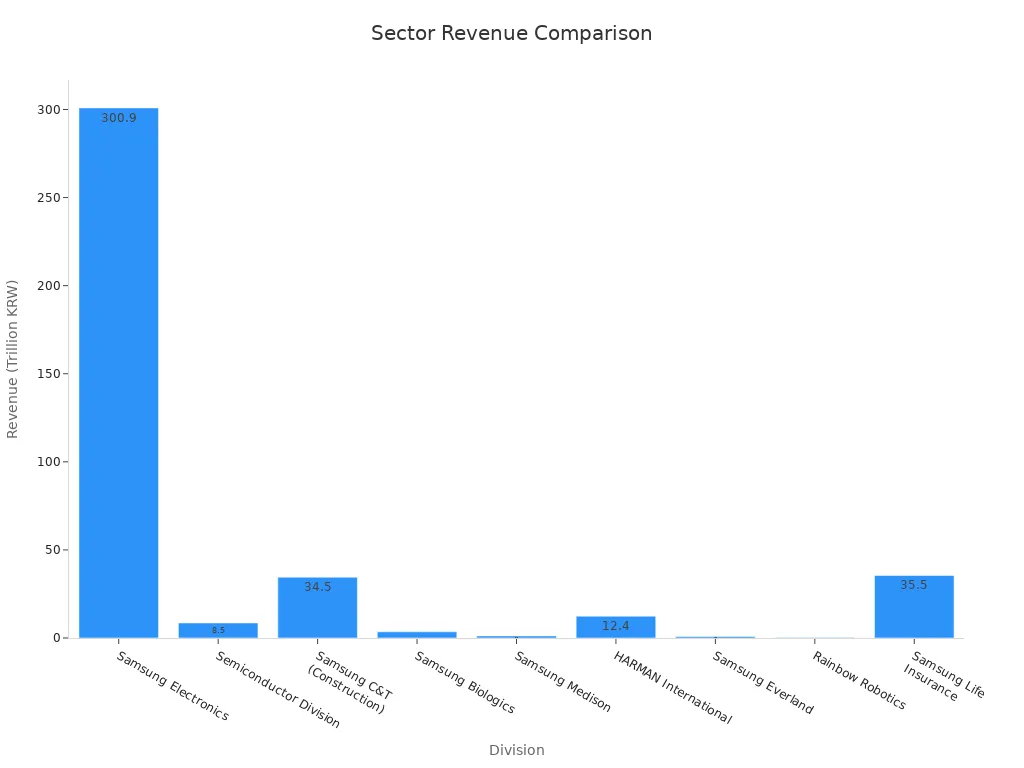
Samsung’s wide reach means it can handle changes in one market by relying on others.
Impact on Finances
Business models shape how companies earn and keep profits. Apple’s focus on premium products leads to higher profit margins. The company makes more money from each sale because customers pay for quality and services. Samsung’s diversification brings steady revenue from many sources, but some areas have lower profit margins. Financial analysis shows that Apple’s model creates more profit per dollar of revenue, while Samsung’s model spreads risk and supports long-term growth.
Profitability analysis helps both companies decide where to invest and which products or services bring the most value.
Key Numbers Table
Market Cap, Revenue, Profit
The table below shows the most important financial numbers for apple and samsung. These numbers help readers see the size and strength of each company.
|
Metric |
Apple (2024/2025) |
Samsung (2024/2025) |
|---|---|---|
|
Market Cap |
~$2.97 trillion |
~$392 billion |
|
Annual Revenue |
~$391 billion |
~$226.5 billion |
|
Net Profit |
~$63.9 billion |
~$32.5 billion |
|
Cash & Investments |
~$202.5 billion |
~$31.4 billion |
|
Profit Margin |
~25% |
~10% |
Note: Market cap means the total value of a company’s shares. Net profit shows how much money the company keeps after paying all costs. Cash and investments show how much money the company can use quickly.
Quick Comparison Points
-
Apple leads in market cap. Its value is much higher than samsung.
-
Apple earns more profit each year. Its profit margin is also higher.
-
Samsung brings in strong revenue, but apple keeps more money from each sale.
-
Apple holds more cash and investments. This gives it more power to invest or handle tough times.
-
Samsung has a wider range of products. It sells more types of electronics and has many business areas.
Investors often look at these numbers to decide which company is stronger. Consumers may see these numbers as a sign of trust and stability.
The numbers show that apple stands as the richer company by most financial measures. Samsung remains a global leader with a broad business, but apple’s focus on profit and cash gives it the edge.
Why It Matters
For Investors
Investors look at financial numbers to decide where to put their money. Revenue shows how big a company is and how fast it can grow. Profitability tells if a company can make money after paying all its bills. Debt level shows if a company owes a lot or a little. Cash flow tells if a company can keep running and pay for new projects. Investors check these numbers in reports like the income statement and balance sheet.
-
The share of Black and Hispanic individuals moving money into investments grew over three times their 2010-15 average by 2023. White and Asian investors saw just over twice the increase.
-
Black and Hispanic investors still make up a small part of all investors.
-
Younger investors and men took more risks during the pandemic, showing that different groups act differently in the market.
-
Extra savings and government help during the pandemic led to more people investing.
-
These changes mean that financial education and advice may need to fit different groups.
Apple and Samsung both attract investors, but their financial health and business models affect risk and reward. Investors often see Apple as a safer choice because of its high profit margins and cash reserves. Samsung’s broad business gives it stability, but it faces more ups and downs in some markets.
For Consumers
Consumers feel the effects of these financial strengths every day. Apple’s high revenue lets it build a smooth ecosystem and offer a premium experience. Many people feel a strong connection to Apple’s brand. Samsung uses its strong revenue to bring out new technology quickly, which attracts buyers who want the latest features.
Recent studies show that 70% of smartphone users stay loyal to their brands. About 90% of Apple users plan to buy another Apple device because they like how everything works together. Innovation matters too, with 65% of people saying it keeps them loyal. Social media and friends also shape what people think about brands.
Market reports show Apple leads in ownership among young adults, but Samsung keeps gaining ground. Apple’s brand feels weaker for people with less money, while Samsung’s appeal stays strong or grows. Price and financial situation play a big role in what people buy.
|
Aspect |
Apple Consumers |
Samsung Consumers |
Other Consumers |
|---|---|---|---|
|
Feature Priorities |
Design, brand status, ecosystem |
Hardware innovation (camera, display) |
Performance-price balance |
|
Satisfaction Drivers |
High ecosystem satisfaction; battery life issues; limited customization |
Appreciate innovation; UI complexity issues |
N/A |
|
Switching Triggers |
Price sensitivity; desire for customization |
Price sensitivity; desire for innovation |
N/A |
|
Emotional Connections |
Status and exclusivity |
Cutting-edge technology |
Value-conscious, performance-focused |
Vertu and the Luxury Market
Vertu stands out as a luxury phone brand, but its financial scale is much smaller than Apple or Samsung. Vertu focuses on exclusivity and craftsmanship, not mass-market sales. While Vertu appeals to a select group, Apple and Samsung reach millions worldwide. Vertu does not compete as the biggest competitor in the tech world, but it shows how some brands target niche markets with unique products.
The data shows that Apple holds a stronger financial position than Samsung. Apple leads in market value, profit, and cash reserves. Recent financial reports reveal higher returns on assets and equity for Apple, while Samsung’s debt ratio increased. Studies also show that companies with better ESG ratings, like Apple, often achieve higher financial performance and resilience. These differences matter because they shape how each company grows and adapts in the fast-changing tech world. Strong financials help a company stay ahead.
FAQ
What is market capitalization?
Market capitalization means the total value of a company’s shares. People calculate it by multiplying the share price by the number of shares. Investors use this number to compare the size of companies.
Why does Apple have higher profits than Samsung?
Apple sells premium products at higher prices. The company focuses on quality and services. This strategy helps Apple earn more profit from each sale than Samsung.
Does Samsung make more products than Apple?
Yes. Samsung creates many products, including phones, TVs, chips, and appliances. Apple mainly makes phones, computers, and services. Samsung’s business covers more industries.
Which company has more cash reserves?
Apple holds more cash and investments than Samsung. This gives Apple more flexibility to invest, buy other companies, or handle tough times.
Can a smaller company like Vertu compete with Apple or Samsung?
No. Vertu targets a small luxury market. Apple and Samsung serve millions of customers worldwide. Their financial power and reach are much greater than Vertu’s.